Experts Say the Housing Market Won't Crash
Monday, January 30, 2023
Add Comment
Displaying blog entries 181-190 of 450

Last year, the housing market slowed down in response to higher mortgage rates, and that had an impact on home prices. If you’re thinking of selling your house soon, that means you’ll want to adjust your expectations accordingly. As realtor.com explains:
“. . . some of the more prominent pandemic trends have changed, so sellers might wish to adjust accordingly to get the best deal possible.”
In a more moderate market, how you price your house will make a big difference to not only your bottom line, but to how quickly your house could sell. And the reality is, homes priced right are still selling in today’s market.
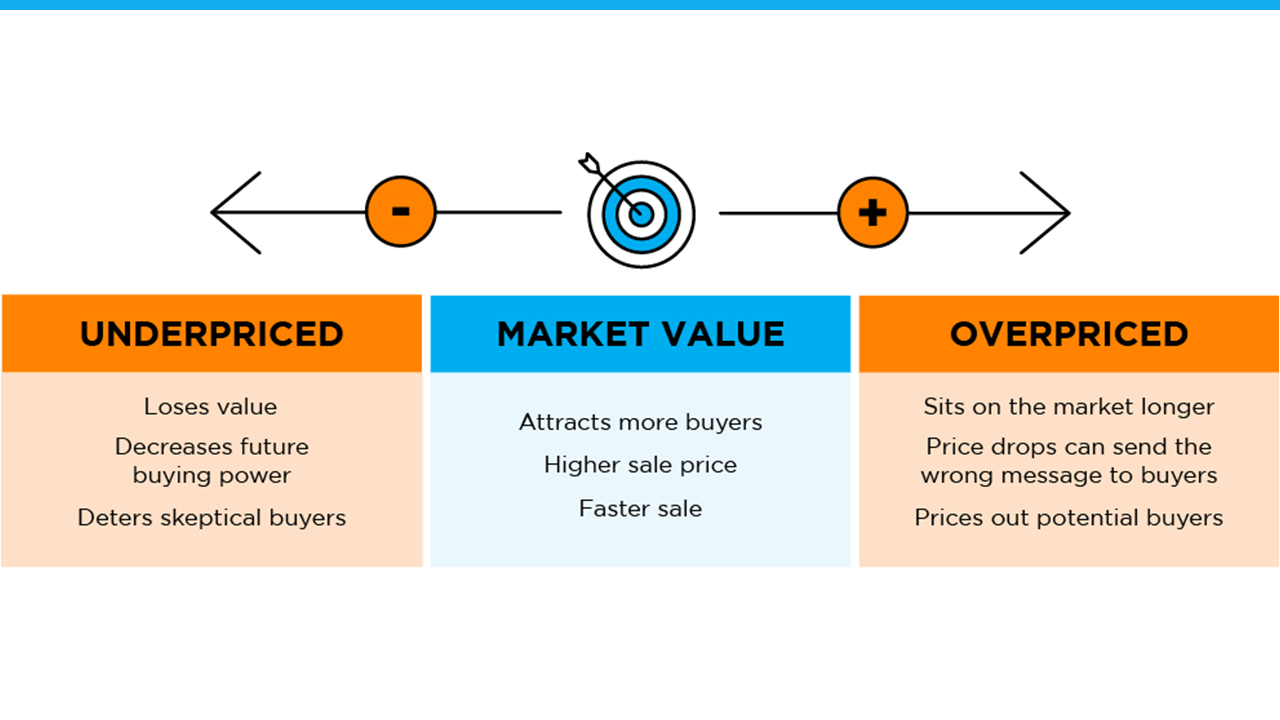
Especially today, your asking price sends a message to potential buyers.
If it’s priced too low, you may leave money on the table or discourage buyers who may see a lower-than-expected price tag and wonder if that means something is wrong with the home.
If it’s priced too high, you run the risk of deterring buyers. When that happens, you may have to lower the price to try to reignite interest in your house when it sits on the market for a while. But be aware that a price drop can be seen as a red flag by some buyers who will wonder what that means about the home.
To avoid either headache, price it right from the start. A real estate professional knows how to determine that ideal asking price. They balance the value of homes in your neighborhood, current market trends, buyer demand, the condition of your house, and more to find the right price. This helps lead to stronger offers and a greater likelihood your house will sell quickly.
The visual below helps summarize the impact your asking price can have:
Homes that are priced at current market value are still selling. To make sure you price your house appropriately, maximize your sales potential, and minimize your hassle, let’s connect.

It doesn’t matter if you’re someone who closely follows the economy or not, chances are you’ve heard whispers of an upcoming recession. Economic conditions are determined by a broad range of factors, so rather than explaining them each in depth, let’s lean on the experts and what history tells us to see what could lie ahead. As Greg McBride, Chief Financial Analyst at Bankrate, says:
“Two-in-three economists are forecasting a recession in 2023 . . .”
As talk about a potential recession grows, you may be wondering what a recession could mean for the housing market. Here’s a look at the historical data to show what happened in real estate during previous recessions to help prove why you shouldn’t be afraid of what a recession could mean for the housing market today.
To show that home prices don’t fall every time there’s a recession, it helps to turn to historical data. As the graph below illustrates, looking at recessions going all the way back to 1980, home prices appreciated in four of the last six of them. So historically, when the economy slows down, it doesn’t mean home values will always fall.
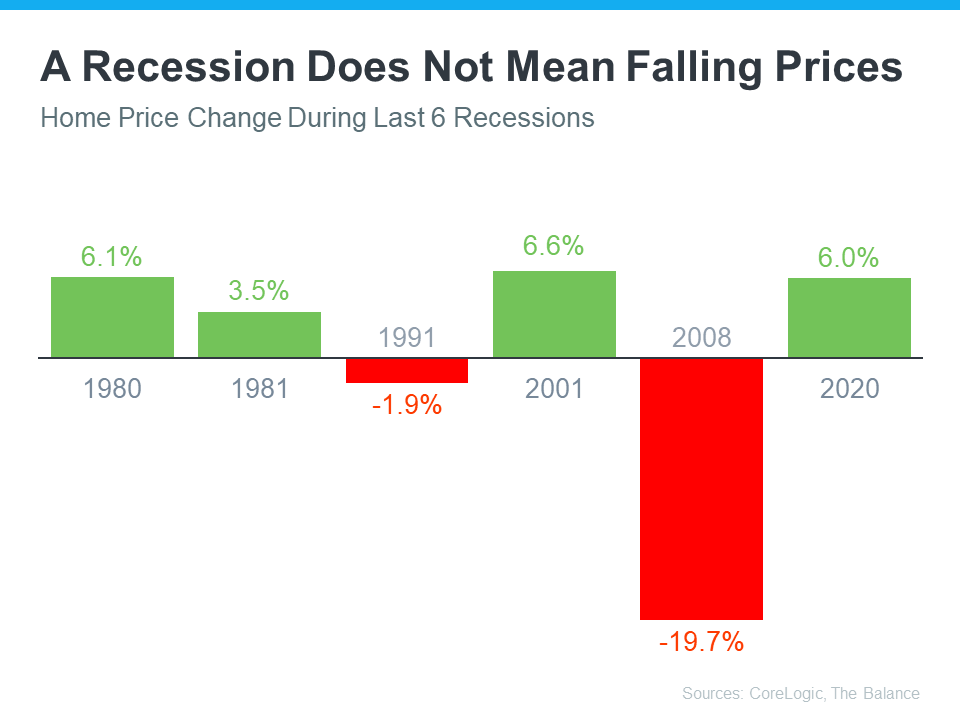
Most people remember the housing crisis in 2008 (the larger of the two red bars in the graph above) and think another recession would be a repeat of what happened to housing then. But today’s housing market isn’t about to crash because the fundamentals of the market are different than they were in 2008. According to experts, home prices will vary by market and may go up or down depending on the local area. But the average of their 2023 forecasts shows prices will net neutral nationwide, not fall drastically like they did in 2008.
Research also helps paint the picture of how a recession could impact the cost of financing a home. As the graph below shows, historically, each time the economy slowed down, mortgage rates decreased.
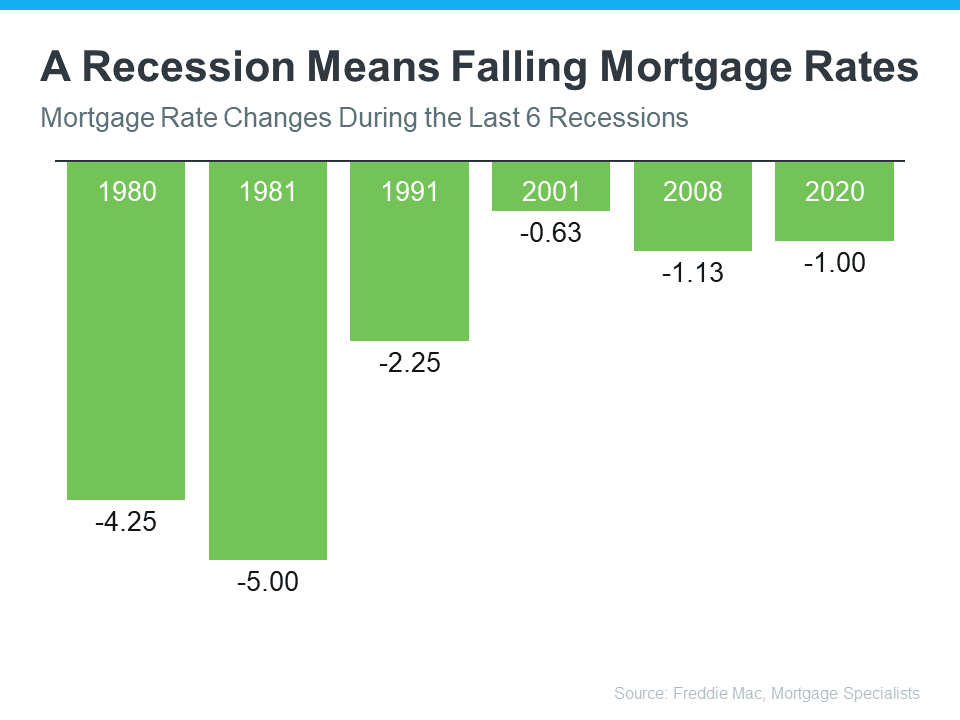
Fortune explains mortgage rates typically fall during an economic slowdown:
“Over the past five recessions, mortgage rates have fallen an average of 1.8 percentage points from the peak seen during the recession to the trough. And in many cases, they continued to fall after the fact as it takes some time to turn things around even when the recession is technically over.”
In 2023, market experts say mortgage rates will likely stabilize below the peak we saw last year. That’s because mortgage rates tend to respond to inflation. And early signs show inflation is starting to cool. If inflation continues to ease, rates may fall a bit more, but the days of 3% are likely behind us.
The big takeaway is you don’t need to fear the word recession when it comes to housing. In fact, experts say a recession would be mild and housing would play a key role in a quick economic rebound. As the 2022 CEO Outlook from KPMG, says:
“Global CEOs see a ‘mild and short’ recession, yet optimistic about global economy over 3-year horizon . . .
More than 8 out of 10 anticipate a recession over the next 12 months, with more than half expecting it to be mild and short.”
While history doesn’t always repeat itself, we can learn from the past. According to historical data, in most recessions, home values have appreciated and mortgage rates have declined.
If you’re thinking about buying or selling a home this year, let’s connect so you have expert advice on what’s happening in the housing market and what that means for your homeownership goals.
![Key Terms To Know When Buying a Home [INFOGRAPHIC] | MyKCM](https://files.mykcm.com/2023/01/11164544/Key-Terms-To-Know-When-Buying-A-Home-MEM-1046x2684.png)

There’s no doubt today’s housing market is very different than the frenzied one from the past couple of years. In the second half of 2022, there was a dramatic shift in real estate, and it caused many people to make comparisons to the 2008 housing crisis. While there may be a few similarities, when looking at key variables now compared to the last housing cycle, there are significant differences.
In the latest Real Estate Forecast Summit, Lawrence Yun, Chief Economist at the National Association of Realtors (NAR), drew the comparisons below between today’s housing market and the previous cycle:
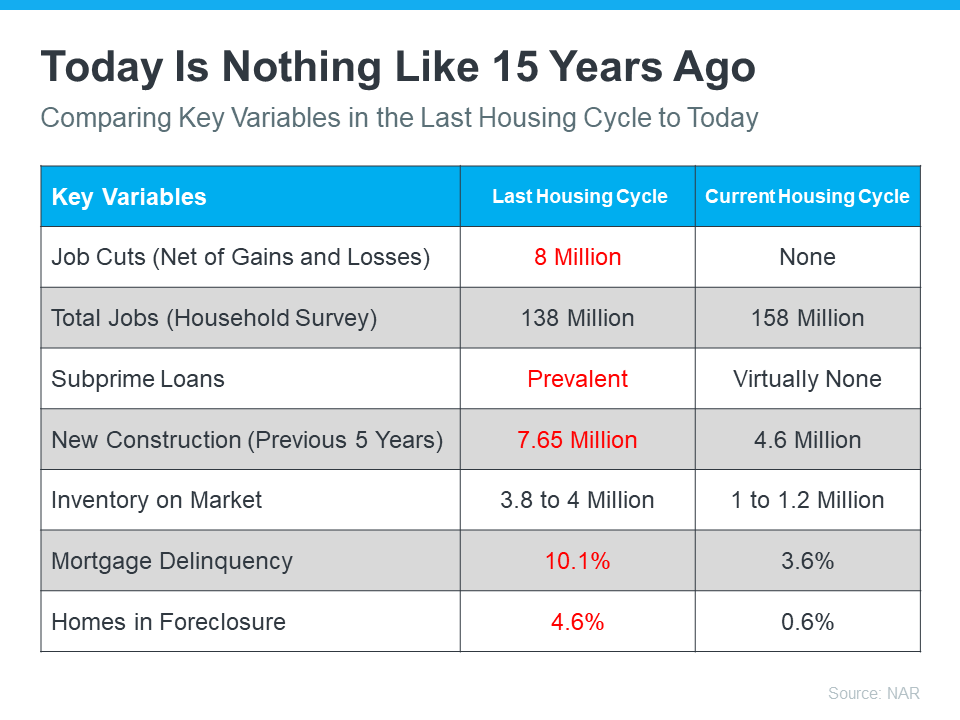
Looking at the facts, it’s clear: today is very different than the housing market of 15 years ago.
And in today’s market, with inventory rising and less competition from other buyers, there’s opportunity right now. According to David Stevens, former Assistant Secretary of Housing:
“So be advised…this may be the one and only window for the next few years to get into a buyer’s market. And remember…as the Federal Reserve data shows…home prices only go up and always recover from recessions no matter how mild or severe. Long term homeowners should view this market…right now…as a unique buying opportunity.”
Today’s housing market is nothing like the real estate market 15 years ago. If you’re a buyer right now, this may be the chance you’ve been waiting for.
Home equity has been a hot topic in real estate news lately. And if you’ve been following along, you may have heard there’s a growing number of homeowners with negative equity. But don’t let those headlines scare you.
In truth, the headlines don’t give you all the information you really need to understand what’s happening and at what scale. Let’s break down one of the big equity stories you may be seeing in the news, and what’s actually taking place. That way, you’ll have the context you need to understand the big picture.
One piece of news circulating focuses on the percentage of homes purchased in 2022 that are currently underwater. The term underwater refers to a scenario where the homeowner owes more on the loan than the house is worth. This was a huge issue when the housing market crashed in 2008, but it much less significant today.
Media coverage right now is based loosely on a report from Black Knight, Inc. The actual report from that source says this:
“Of all homes purchased with a mortgage in 2022, 8% are now at least marginally underwater and nearly 40% have less than 10% equity stakes in their home, . . .”
Let’s unpack that for a moment and provide the bigger picture. The data-bound report from Black Knight is talking specifically about homes purchased in 2022, but media headlines don’t always mention that timeframe or provide the surrounding context about how unusual of a year 2022 was for the housing market. In 2022, home price appreciation soared, and it reached its max around March-April. Since then, the rate of appreciation has been slowing down.
Homeowners who bought their house last year right at the peak or those who paid more than market value in the months that followed are more likely to fall into the category of being marginally underwater. The qualifier marginally is another key piece of the puzzle the media isn’t necessarily including in their coverage.
So, what does that mean for those who purchased a home in 2022? It’s important to remember, owning a home is a long-term investment, not a short-term play. When headlines focus on the short-term view, they’re not necessarily providing the full context.
Typically speaking, the longer you stay in your home, the more equity you gain as you pay down your loan and as home prices appreciate. With recent market conditions, you may not have gained significant equity right away if you owned the home for just a few months. But it’s also true that many homeowners who recently bought their house are unlikely to be looking to sell quite yet.
As with everything, knowing the context is important. If you have questions about real estate headlines or about how much equity you have in your home, let’s connect.

If you’re a renter on Mt. Hood, you likely face an important decision every year: renew your current lease, start a new one, or buy a home. This year is no different. But before you dive too deeply into your options, it helps to understand the true costs of renting moving forward if you can even find one in the Mt. Hood area.
In the past year, both current renters and new renters have seen their rent go up based on information from realtor.com:
“Three out of four renters (74.2%) who have moved in the past 12 months reported seeing their rent increase. The strain from recent rent hikes isn’t exclusive to renters who have recently moved. Nearly two-thirds of renters (63.2%) who have lived in their current rental between 12 and 24 months, and likely renewed their lease, have also reported increases in their rent.”
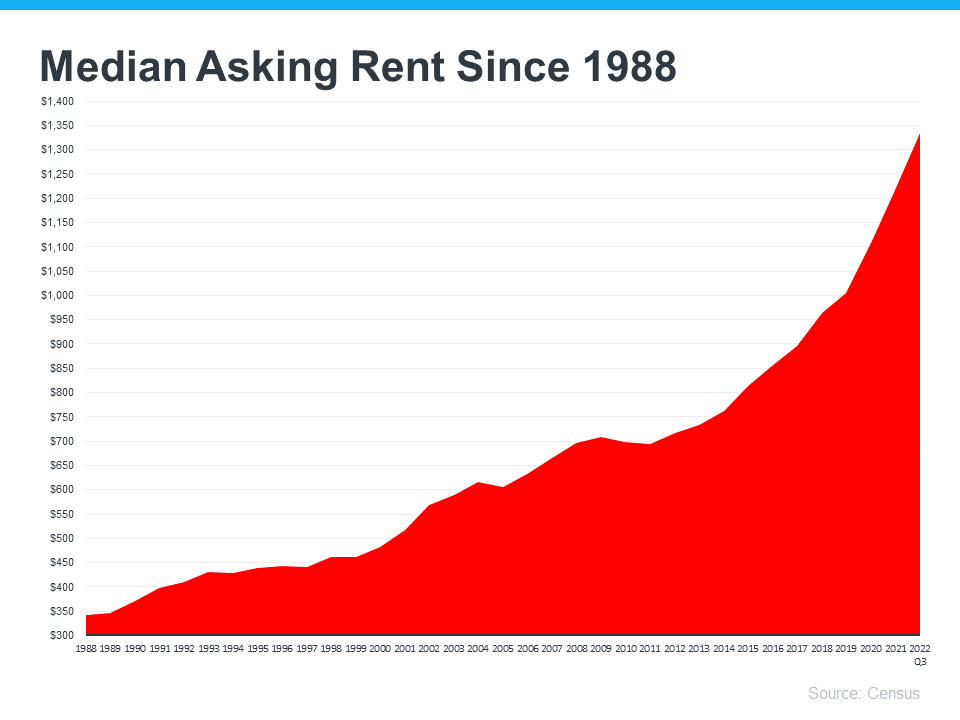
And if you look back at historical data, that shouldn’t come as surprise. That’s because, according to the Census, rents have been rising fairly consistently since 1988 (see graph below):
So, if you’re considering renting as an option in 2023, it’s worth weighing whether this trend is likely to continue. The 2023 Housing Forecast from realtor.com expects rents will keep climbing (see graph below):
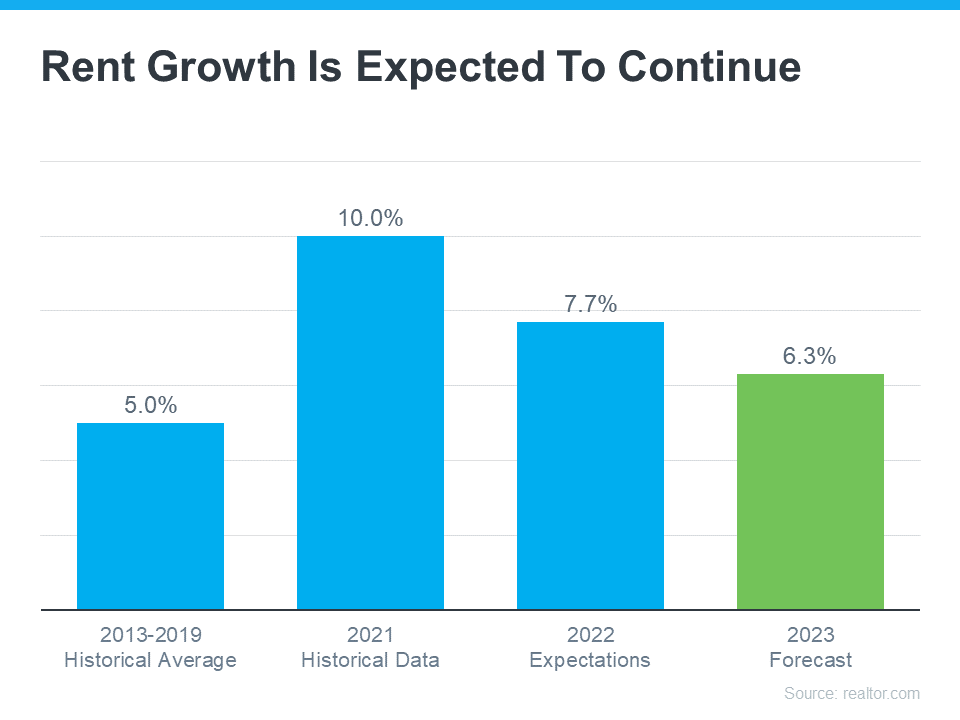
That forecast projects rents will increase by 6.3% in the year ahead (shown in green). When compared to the blue bars in the graph, it’s clear that the 2023 projection doesn’t call for an increase as drastic as the ones renters have seen over the past two years, but it’s still above the historical average for rent hikes between 2013-2019.
That means, if you’re planning to rent again this year and you’ve not yet renewed your lease, you may pay more when you do.
These rising costs may make you reconsider what other alternatives you have. If you're looking for more stability, it could be time to prioritize homeownership. One of the many benefits of owning your own home is it provides a stable monthly cost that you can lock in for the duration of your loan. As Freddie Mac says:
“Monthly rent payments may increase over time, but a fixed-rate mortgage will ensure that you're paying the same amount each month. With a fixed-rate mortgage, your interest rate is locked in for the life of loan. Steady payments allow you to budget wisely and make plans for the future.”
If you’re planning to make a move this year, locking in your monthly housing costs for the duration of your loan can be a major benefit. You’ll avoid wondering if you’ll need to adjust your budget to account for annual increases like you would if you left your housing payment up to your landlord and their renewal cycle.
Homeowners also enjoy the added benefit of home equity, which has grown substantially. In fact, the latest Homeowner Equity Insight report from CoreLogic shows the average homeowner gained $34,300 in equity over the last 12 months. As a renter, your rent payment only covers the cost of your dwelling. When you pay your mortgage on a house, you grow your wealth through the forced savings that is your home equity.
If you’re thinking of renting this year, it’s important to keep in mind the true costs you’ll face. Let’s chat to see how you can begin your journey to homeownership today.

While it’s exciting to start thinking about moving in and decorating after you’ve applied for your mortgage, there are some key things to keep in mind before you close. Here’s a list of things you may not realize you need to avoid after applying for your home loan.
Lenders need to source your money, and cash isn’t easily traceable. Before you deposit any amount of cash into your accounts, discuss the proper way to document your transactions with your loan officer.
It’s not just home-related purchases that could disqualify you from your loan. Any large purchases can be red flags for lenders. People with new debt have higher debt-to-income ratios (how much debt you have compared to your monthly income). Since higher ratios make for riskier loans, borrowers may no longer qualify for their mortgage. Resist the temptation to make any large purchases, even for furniture or appliances.
When you cosign for a loan, you’re making yourself accountable for that loan’s success and repayment. With that obligation comes higher debt-to-income ratios as well. Even if you promise you won’t be the one making the payments, your lender will have to count the payments against you.
Lenders need to source and track your assets. That task is much easier when there’s consistency among your accounts. Before you transfer any money, speak with your loan officer.
It doesn’t matter whether it’s a new credit card or a new car, when you have your credit report run by organizations in multiple financial channels (mortgage, credit card, auto, etc.), it will have an impact on your FICO® score. Lower credit scores can determine your interest rate and possibly even your eligibility for approval.
Many buyers believe having less available credit makes them less risky and more likely to be approved. This isn’t true. A major component of your score is your length and depth of credit history (as opposed to just your payment history) and your total usage of credit as a percentage of available credit. Closing accounts has a negative impact on both of those aspects of your score.
Be upfront about any changes that occur or you’re expecting to occur when talking with your lender. Blips in income, assets or credit should be reviewed and executed in a way that ensures your home loan can still be approved. If your job or employment status has changed recently, share that with your lender as well. Ultimately, it’s best to fully disclose and discuss your intentions with your loan officer before you do anything financial in nature.
You want your home purchase to go as smoothly as possible. Remember, before you make any large purchases, move your money around, or make major life changes, be sure to consult your lender – someone who’s qualified to explain how your financial decisions may impact your home loan.
Displaying blog entries 181-190 of 450