Like most industries, residential real estate has a seasonality to it. For example, toy stores sell more toys in October, November, and December than they do in any other three-month span throughout the year. More cars are sold in the U.S. during the second quarter (April, May, and June) than in any other quarter of the year.
Real estate is very similar. The number of homes sold in the spring is almost always much greater than at any other time of the year. It’s even labeled as the spring buying season. Historically, the number of buyers and listings for sale significantly increase in the spring and remains strong throughout the summer. Once fall sets in, the number of buyers and sellers typically drops off.
Last year, however, that seasonality didn’t happen. The outbreak of the virus and subsequent slowing of the economy limited sales during the spring market. These sales were pushed back later in the year, and last fall and winter saw a dramatic increase in home sales over previous years. The only thing that held the market back was the extremely limited supply of homes for sale.
What About This Winter?
Some experts thought we’d return to the industry’s normal seasonality this winter with both the number of purchasers and houses available for sale falling off. However, data now shows that neither of those situations will likely occur. Buyer demand is still extremely strong, and it appears we may soon see a somewhat uncharacteristic increase in the number of homes coming to the market.
Buyer Demand Remains Strong
The latest Showing Index from ShowingTime, which tracks the average number of monthly showings on available homes, indicates buyer activity was slightly lower than at the same time last year but much higher than any of the three previous years (see chart below):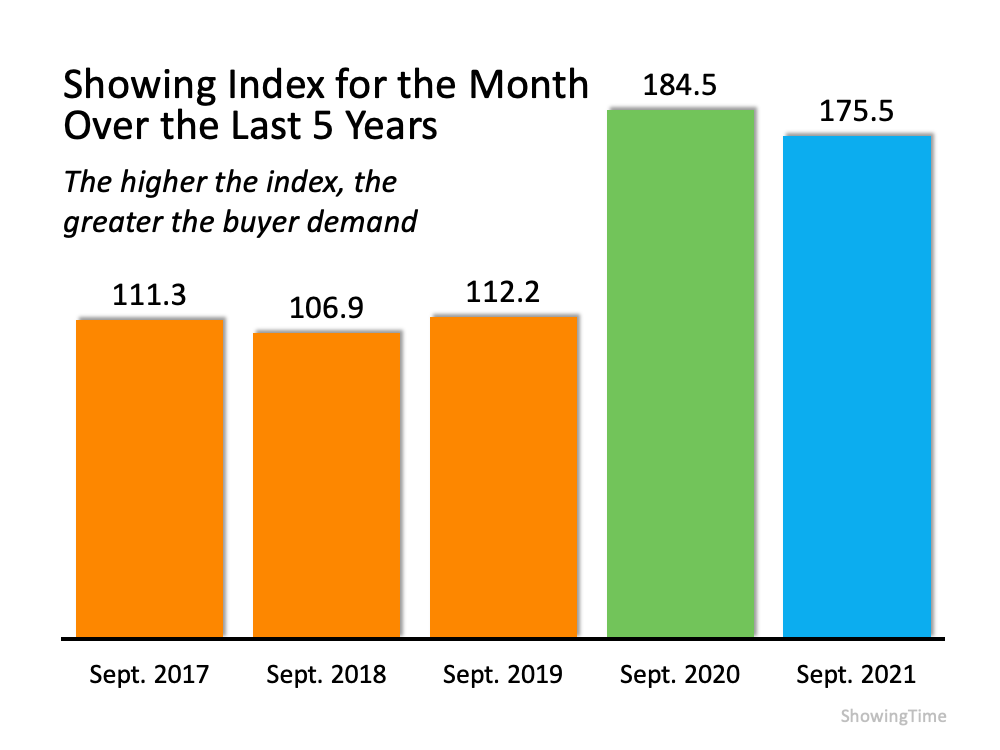 A report from realtor.com confirms buying activity remains strong in the existing home sales market:
“New housing data shows 2021's feverish home sales pace broke a yearly record in October, . . . with last month marking the eighth straight month of buyers snatching up homes more quickly than the fastest pace in previous years. . . .”
Buyer activity for newly constructed homes is also very strong. Ali Wolf, Chief Economist for Zonda, recently reported that Stuart Miller, the Executive Chairman of Lennar, one of the nation’s largest home builders, said this about demand:
“There is still a great deal of demand at our sales centers with people lining up and not enough supply.”
The only question heading into this winter is whether the number of listings available could come close to meeting this buyer demand. We may have just received the answer to that question.
Sellers Are About To List – Right Now
Instead of waiting for the normal spring buying market, new research indicates that homeowners thinking about selling are about to put their homes on the market this winter.
Speaking to the release of a report on this recent research, George Ratiu, Manager of Economic Research for realtor.com, said:
“The pandemic has delayed plans for many Americans, and homeowners looking to move on to the next stage of life are no exception. Recent survey data suggests the majority of prospective sellers are actively preparing to enter the market this winter.”
Here are some highlights in the report:
Of homeowners planning to enter the market in the next year:
- 65% - Have just listed (19%) or plan to list this winter
- 93% - Have already taken steps toward listing their home, including working with an agent (28%)
- 36% - Have researched the value of their home and others in their neighborhood
- 36% - Have started making repairs or decluttering
The report also discusses the reasons sellers want to move:
- 33% - Have realized they want different home features
- 37% - Say their home no longer meets their family's needs
- 32% - Want to move closer to friends and family
- 23% - Are looking for a home office
Data shows buyer demand remains unusually strong going into this winter. Research indicates the supply of inventory is about to increase. This could be a winter real estate market like never before. Mt. Hood buyers are waiting patiently for the next new listing. We currently have ten properties for sale in the Mt. Hood Village area. Only two are under $500,000.
Bottom Line
If you’re thinking of buying or selling, now is the time to have a heart-to-heart conversation with a real estate professional in your market, as things are about to change in an unexpected way.

![Your Journey to Homeownership [INFOGRAPHIC] | MyKCM](https://files.mykcm.com/2021/11/18120549/20211119-MEM-1046x2358.png)


![Numbers Don’t Lie – It’s Still a Great Time To Sell [INFOGRAPHIC] | MyKCM](https://files.mykcm.com/2021/11/04145531/20211105-MEM-1046x2041.png)

![Your Home Equity Is Growing [INFOGRAPHIC] | MyKCM](https://files.mykcm.com/2021/10/18091034/20211022-MEM-1046x2053.png)