Home Price Forecasts for the Second Half of 2025
Tuesday, July 29, 2025
Add Comment
Displaying blog entries 1-6 of 6

Foreclosure headlines are making noise again – and they’re designed to stir up fear to get you to read them. But what the data shows is actually happening in the market tells a very different story than what you might be led to believe. So, before you jump to conclusions, it’s important to look at the full picture.
Yes, foreclosure starts are up 7% in the first six months of the year. But zooming out shows that’s nowhere near crisis levels. Here’s why.
Even with the recent uptick, overall foreclosure filings are still very low. In the first half of 2025, just 0.13% of homes had filed for foreclosure. That’s less than 1% of homes in this country. In fact, it’s even far less than that at under a quarter of a percent. That’s a very small fraction of all the homes out there. But like with anything else in real estate, the numbers vary by market.
Here’s the map you need to see that shows how foreclosure rates are lower than you might think, and how they differ by local area:
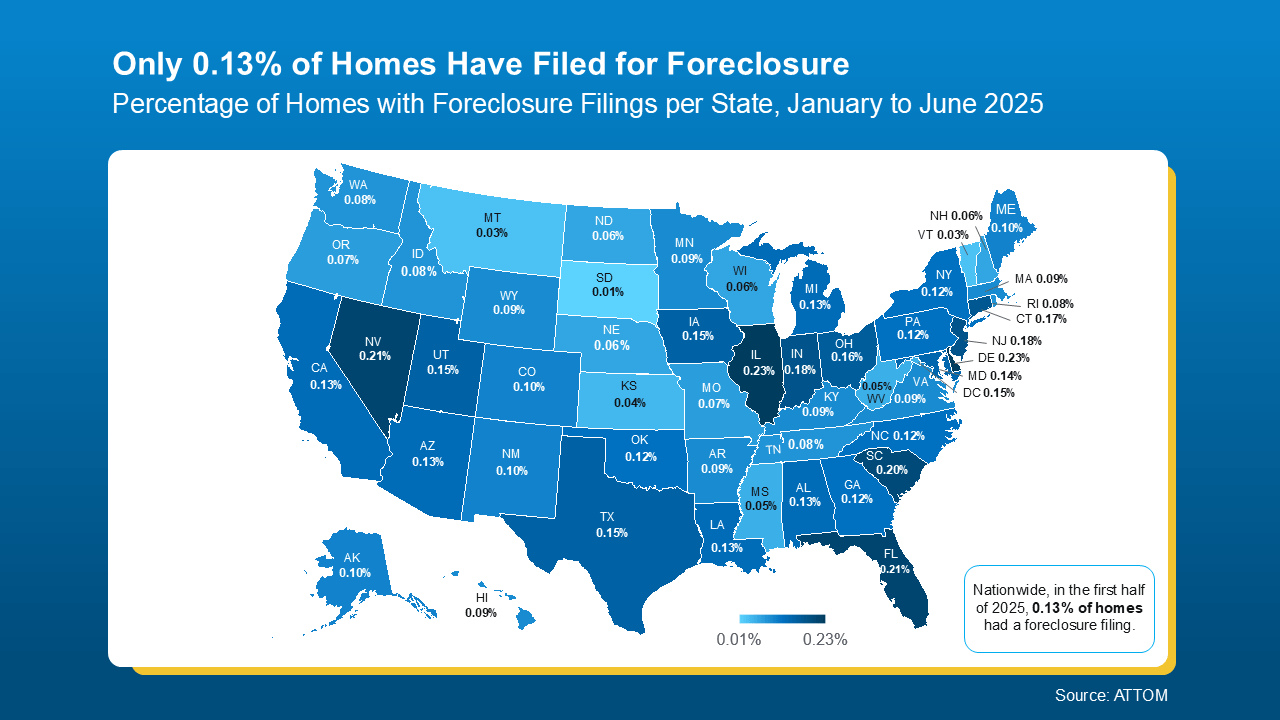 For context, data from ATTOM shows in the first half of 2025, 1 in every 758 homes nationwide had a foreclosure filing. Thats the 0.13% you can see in the map above. But in 2010, back during the crash? Mortgage News Daily says it was 1 in every 45 homes.
But here’s what everyone remembers…
Leading up to the crash, risky lending practices left homeowners with payments they eventually couldn’t afford. That led to a situation where many homeowners were underwater on their mortgages. When they couldn’t make their payments, they had no choice but to walk away. foreclosures surged, and the market ultimately crashed.
Today’s housing market is very different. Lending standards are stronger. Homeowners have near record levels of equity. And when someone hits financial trouble, that equity means many people can sell their home rather than face foreclosure. As Rick Sharga, Founder of CJ Patrick Company, explains:
“. . . a significant factor contributing to today’s comparatively low levels of foreclosure activity is that homeowners—including those in foreclosure—possess an unprecedented amount of home equity.”
No one wants to see a homeowner struggle. But if you’re a homeowner facing hardship, talk to your mortgage provider. You may have more options than you think.
Recent headlines may not tell the whole story, but the data does. Foreclosure activity remains low by historical standards and is not a sign of another crash.
If you’re simply watching the market and want to understand what’s really going on, or how this impacts the value of your home, let’s connect. I’ll help you separate fact from fear by showing you what the data really says.
|
||||||||||||||||||||||||||||||||||||
|

There are plenty of headlines these days calling for a housing market crash. But the truth is, they’re not telling the full story. Here’s what’s actually happening, and what the experts project for home prices over the next 5 years. And spoiler alert – it’s not a crash.
Yes, in some local markets, prices are flattening or even dipping slightly this year as more homes hit the market. That’s normal with rising inventory. But the bigger picture is what really matters, and it’s far less dramatic than what the doom-and-gloom headlines suggest. Here’s why.
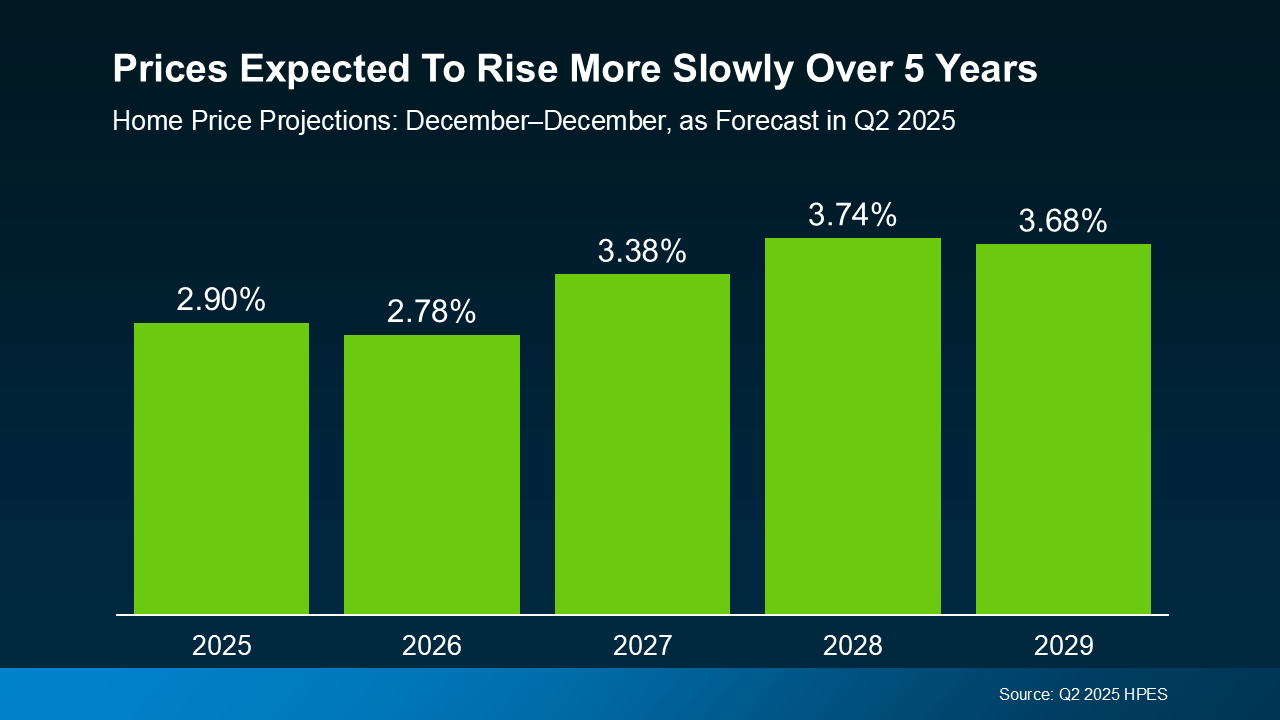
Over 100 leading housing market experts were surveyed in the latest Home Price Expectations Survey (HPES) from Fannie Mae. Their collective forecast shows prices are projected to keep rising over the next 5 years, just at a slower, healthier pace than what we’ve seen more recently. And that kind of steady, sustainable growth should be one factor to help ease your fears about the years ahead (see graph below):
 And if you take a look at how the various experts responded within the survey, they fall into three main categories: those that were most optimistic about the forecast, most pessimistic, and the overall average outlook.
Here’s what the breakdown shows:
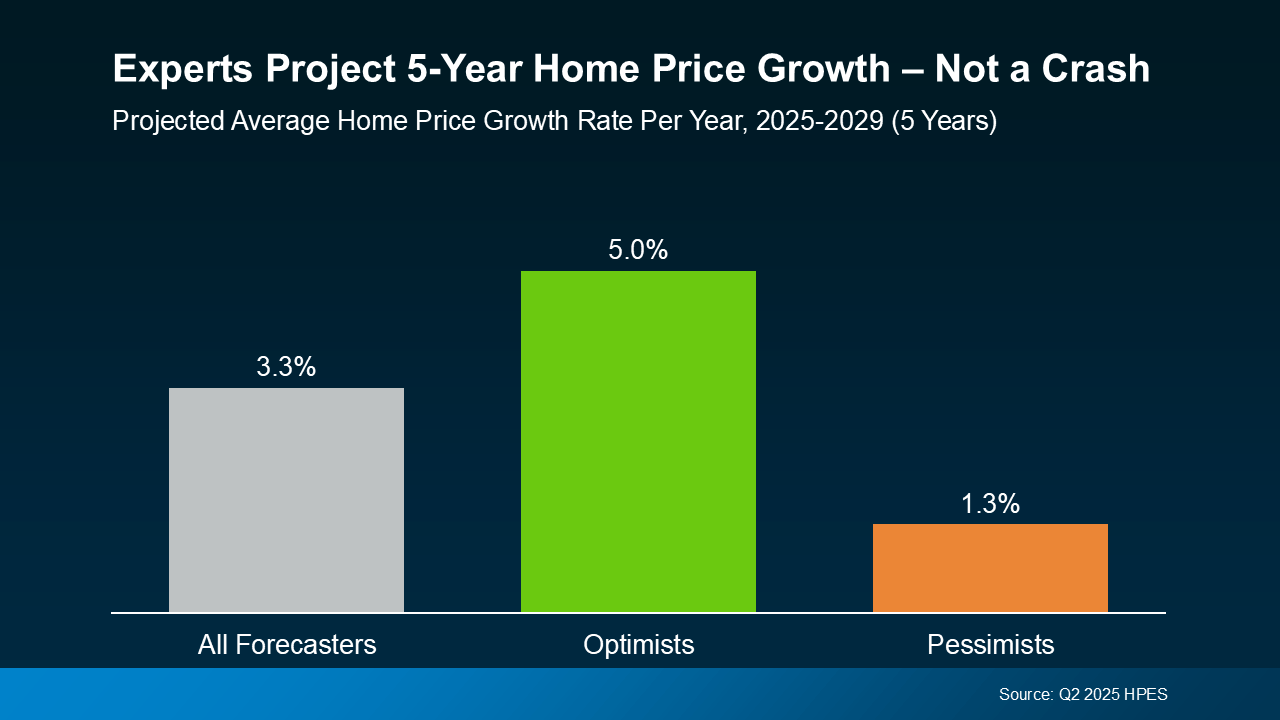
Do they all agree on the same number? Of course not. But here’s the key takeaway: not one expert group is calling for a major national decline or a crash. Instead, they expect home prices to rise at a steady, more sustainable pace.
That’s much healthier for the market – and for you. Yes, some areas may see prices hold relatively flat or dip a bit in the short term, especially where inventory is on the rise. Others may appreciate faster than the national average because there are still fewer homes for sale than there are buyers trying to purchase them. But overall, more moderate price growth is cooling the rapid spikes we saw during the frenzy of the past few years.
And remember, even the most conservative experts still project prices will rise over the course of the next 5 years. That’s also because foreclosures are low, lending standards are in check, and homeowners have near record equity to boost the stability of the market. Together, those factors help prevent a wave of forced sales, like the kind that could drag prices down. So, if you’re waiting for a significant crash before you buy, you might be waiting quite a long time.
If you’ve been on the fence about your plans, now’s the time to get clarity. The market isn’t heading for a crash. It’s on track for steady, slow, long-term growth overall, with some regional ups and downs along the way.
Want to know what that means for our neighborhood? Because national trends set the tone, but what really matters is what’s happening in your zip code. Let’s have a quick conversation so you can see exactly what our local data means for you.

Displaying blog entries 1-6 of 6