Real Estate Information Archive

Blog

Displaying blog entries 21-30 of 348

Supply and Demand in the Mt. Hood Real Estate Market

by Liz Warren

How Supply and Demand Can Impact Your Buying and Selling Goals in the Mt. Hood Market

How Supply and Demand Can Impact Your Buying and Selling Goals | MyKCM
 

In today’s Mt. Hood housing market, there are far more buyers looking for homes than sellers listing their houses. Based on the concept of supply and demand, this means home prices will naturally rise. Why is that? When there are more people trying to buy an item than there are making that item available for sale, that drives prices up. And that’s exactly the case in today’s housing market. So, knowing what’s happening with the inventory of homes for sale and the demand for housing is crucial for today’s buyers and sellers.

Nationally, Demand Is High and Supply Is Very Low

The latest buyer and seller activity data from the National Association of Realtors (NAR) indicates buyer traffic heavily outweighs seller traffic today, as shown in the maps below. There are far darker blues (strong buyer activity) on the left and much lighter blues (weak seller activity) on the right. In other words, this shows how the demand for homes is significantly greater than what’s available to purchase.

How Supply and Demand Can Impact Your Buying and Selling Goals | MyKCM

What Does This Mean if You’re a Mt. Hood Seller?

Supply is struggling to keep pace with demand. In fact, the inventory of homes for sale recently hit an all-time low. That gives you an incredible advantage when you sell your house. With so few listings, it’s likely more potential buyers will view your house – especially if you work with an agent to price it right. That means there’s a high chance you’ll receive multiple offers or buyers will enter a bidding war for your house. And that dynamic can drive the sale price of your home up.

What Does This Mean if You’re a Buyer?

As a buyer with fewer options available, you’re likely to see more competition, so you need to be strategic to win. First, make sure you have a trusted professional on your side. Your real estate agent will help you understand your local market and work with you to act quickly when the time is right. Even when it’s challenging to find a home, you can still succeed as a buyer today if you have a trusted advisor on your side every step of the way.

Bottom Line

Whether you’re a homebuyer, seller, or both, knowledge truly is power. Let’s connect today so you can better understand what’s happening in our local market and achieve your home buying and selling goals this year.

January 2022 Sales Numbers for Mt. Hood

by Liz Warren

January 2022 stats are in for Mt. Hood area sales. We started off the year with five new listings . We saw 25% less pending sales compared to 2021 in the same month. The big shocker is the average sales price for January at $813,800! With only seven sales, the $2,750,000 price of the ski camp lodge near Wapinitia surly shifted numbers upwards for the month. This did raise the median sales price up to $551,000 for the mountain. Needless to say, we’ve never seen a market like this!


        RMLS sales chart for January 2022 Mt. Hood area


One More Reason Folks Buy on Mt. Hood

by Liz Warren

The Perks of Owning More Than One Home

The Perks of Owning More Than One Home | MyKCM
 

Many things have changed over the past couple of years, and real estate is no exception. One impact is an increased desire to own more than one home. According to the recent Luxury Market Report from Luxury Home Marketing:

“As trends such as remote working and flexi-hours took hold in 2021, so too did the flexibility of relocating as well as the growth of second homeownership.”

This may be because the pandemic has altered how we think about our homes. Where we live has become, more than ever, our safe space and our getaway. And with the rise in remote work, more people are reconsidering where they want to live and buying second homes to give them greater flexibility. If you fall in that category, here are just a few of the perks you’ll enjoy, and how owning a second home may be a great decision for your lifestyle and your future.

Enjoy a Change in Scenery (or Weather)

When you have two homes, you can alternate between them as the weather changes or as you crave different scenery. Do you want to live in an area with a particular season? Would alternating between a resort and a suburban setting be ideal? With two homes, you have those options. Being able to move between homes based on which location best suits you at the time gives you added flexibility and variety that can help increase your happiness.

Build Your Wealth Faster

You may have heard that home equity is skyrocketing, thanks to ongoing home price appreciation. CoreLogic reports that the average homeowner gained $56,700 in equity over the last year. With home prices projected to continue rising, if you purchase a second home, you could benefit from rising equity on both properties to build your wealth (and your net worth) even faster.

Be Closer to Loved Ones

The pandemic has also reignited the importance of being near our loved ones. One option worth exploring is whether you want your second home to be near the people who matter most in your life. This makes it easier to see your loved ones but still gives you your own dedicated, private space so you can be nearby for major life events or longer visits.

Lock in Your Expenses

Buying a second home today and locking in your mortgage rate may be a good option if you’re looking to stabilize your housing costs for the long haul. If you’re approaching retirement or are looking to use your second home as your permanent residence in the future, buying that house now with today’s rate and price may be a good financial decision. That way, no matter what happens with rates and prices in years ahead, your monthly payment is locked in for the next 15-30 years.

Bottom Line

Having multiple homes has considerable benefits. If owning a second home is something you’re interested in, let’s connect to explore your options, discuss the benefits, and take the next step to start your home search.

Housing Bubble?

by Liz Warren

4 Simple Graphs Showing Why This Is Not a Housing Bubble in the Country or on Mt. Hood

4 Simple Graphs Showing Why This Is Not a Housing Bubble | MyKCM
 

recent survey revealed that many consumers believe there’s a housing bubble beginning to form. That feeling is understandable, as year-over-year home price appreciation is still in the double digits. However, this market is very different than it was during the housing crash 15 years ago. Here are four key reasons why today is nothing like the last time.

1. Houses Are Not Unaffordable Like They Were During the Housing Boom

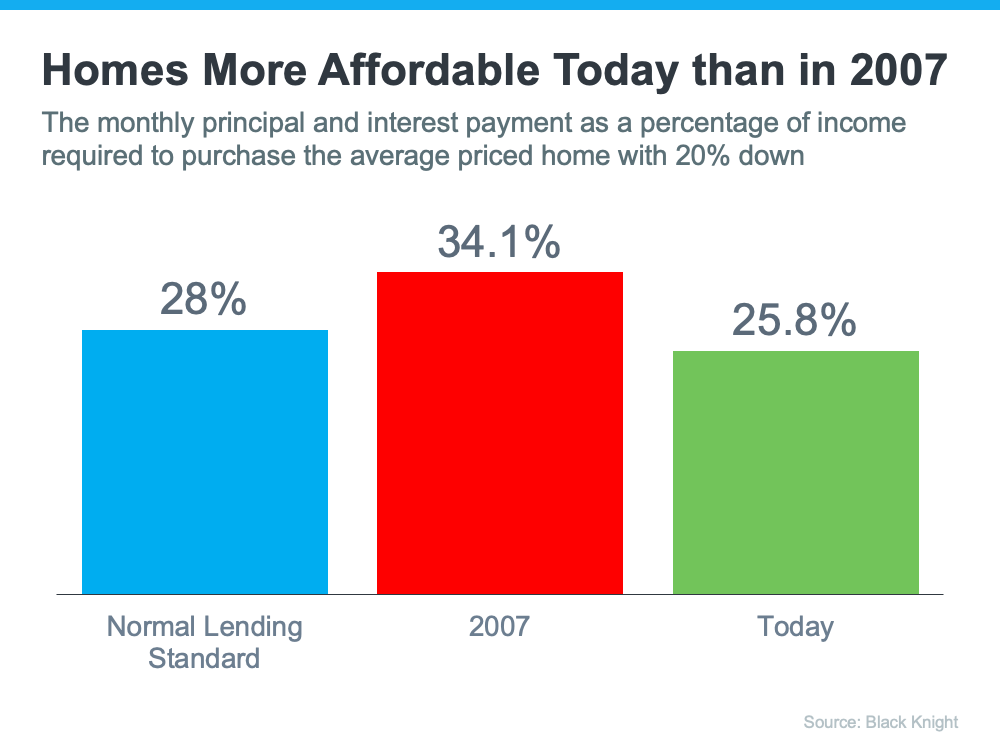
The affordability formula has three components: the price of the home, wages earned by the purchaser, and the mortgage rate available at the time. Conventional lending standards say a purchaser should not spend more than 28% of their gross income on their mortgage payment.

Fifteen years ago, prices were high, wages were low, and mortgage rates were over 6%. Today, prices are still high. Wages, however, have increased, and the mortgage rate, even after the recent spike, is still well below 6%. That means the average purchaser today pays less of their monthly income toward their mortgage payment than they did back then.

In the latest Affordability Report by ATTOM Data, Chief Product Officer Todd Teta addresses that exact point:

“The average wage earner can still afford the typical home across the U.S., but the financial comfort zone continues shrinking as home prices keep soaring and mortgage rates tick upward.”

Affordability isn’t as strong as it was last year, but it’s much better than it was during the boom. Here’s a chart showing that difference:

4 Simple Graphs Showing Why This Is Not a Housing Bubble | MyKCM

If costs were so prohibitive, how did so many homes sell during the housing boom?

2. Mortgage Standards Were Much More Relaxed During the Boom

During the housing bubble, it was much easier to get a mortgage than it is today. As an example, let’s review the number of mortgages granted to purchasers with credit scores under 620. According to credit.org, a credit score between 550-619 is considered poor. In defining those with a score below 620, they explain:

“Credit agencies consider consumers with credit delinquencies, account rejections, and little credit history as subprime borrowers due to their high credit risk.”

Buyers can still qualify for a mortgage with a credit score that low, but they’re considered riskier borrowers. Here’s a graph showing the mortgage volume issued to purchasers with a credit score less than 620 during the housing boom, and the subsequent volume in the 14 years since.

4 Simple Graphs Showing Why This Is Not a Housing Bubble | MyKCM

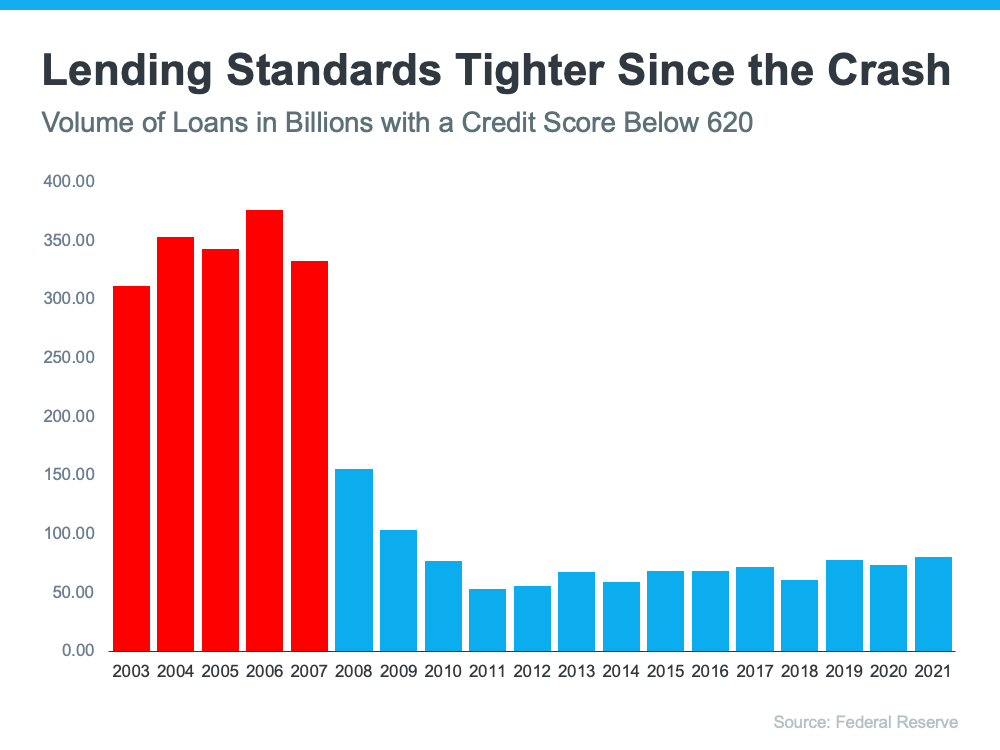
Mortgage standards are nothing like they were the last time. Purchasers that acquired a mortgage over the last decade are much more qualified. Let’s take a look at what that means going forward.

3. The Foreclosure Situation Is Nothing Like It Was During the Crash

The most obvious difference is the number of homeowners that were facing foreclosure after the housing bubble burst. The Federal Reserve issues a report showing the number of consumers with a new foreclosure notice. Here are the numbers during the crash compared to today:

4 Simple Graphs Showing Why This Is Not a Housing Bubble | MyKCM

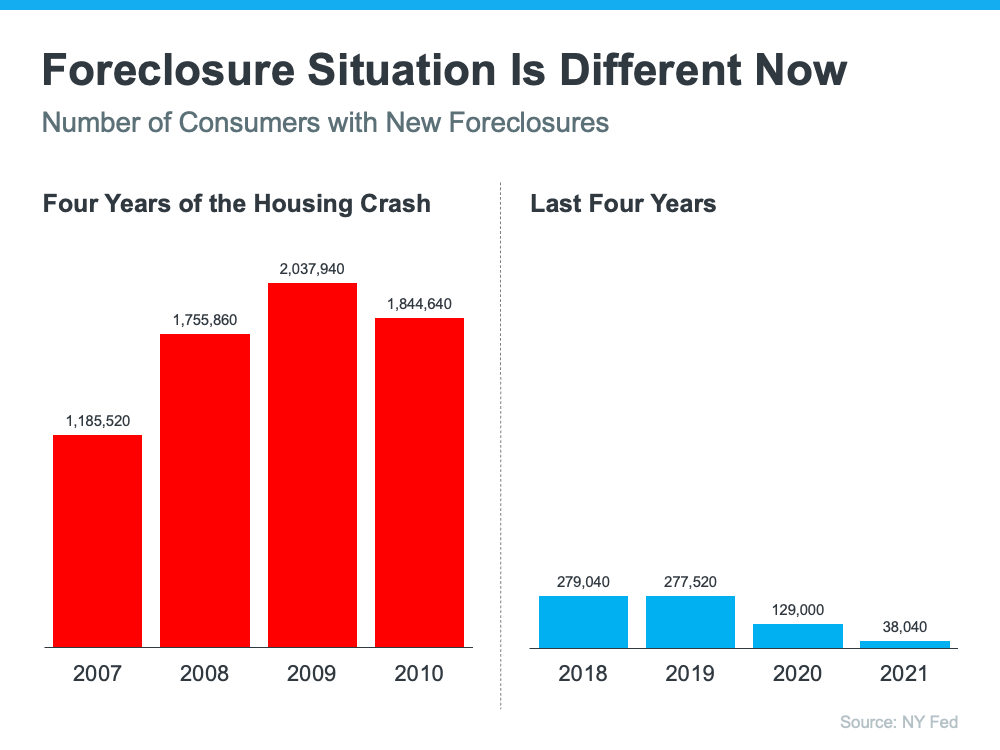
There’s no doubt the 2020 and 2021 numbers are impacted by the forbearance program, which was created to help homeowners facing uncertainty during the pandemic. However, there are fewer than 800,000 homeowners left in the program today, and most of those will be able to work out a repayment plan with their banks.

Rick Sharga, Executive Vice President of RealtyTracexplains:

“The fact that foreclosure starts declined despite hundreds of thousands of borrowers exiting the CARES Act mortgage forbearance program over the last few months is very encouraging. It suggests that the ‘forbearance equals foreclosure’ narrative was incorrect.”

Why are there so few foreclosures now? Today, homeowners are equity rich, not tapped out.

In the run-up to the housing bubble, some homeowners were using their homes as personal ATM machines. Many immediately withdrew their equity once it built up. When home values began to fall, some homeowners found themselves in a negative equity situation where the amount they owed on their mortgage was greater than the value of their home. Some of those households decided to walk away from their homes, and that led to a rash of distressed property listings (foreclosures and short sales), which sold at huge discounts, thus lowering the value of other homes in the area.

Homeowners, however, have learned their lessons. Prices have risen nicely over the last few years, leading to over 40% of homes in the country having more than 50% equity. But owners have not been tapping into it like the last time, as evidenced by the fact that national tappable equity has increased to a record $9.9 trillion. With the average home equity now standing at $300,000, what happened last time won’t happen today.

As the latest Homeowner Equity Insights report from CoreLogic explains:

“Not only have equity gains helped homeowners more seamlessly transition out of forbearance and avoid a distressed sale, but they’ve also enabled many to continue building their wealth.”

There will be nowhere near the same number of foreclosures as we saw during the crash. So, what does that mean for the housing market?

4. We Don’t Have a Surplus of Homes on the Market – We Have a Shortage

The supply of inventory needed to sustain a normal real estate market is approximately six months. Anything more than that is an overabundance and will causes prices to depreciate. Anything less than that is a shortage and will lead to continued price appreciation. As the next graph shows, there were too many homes for sale from 2007 to 2010 (many of which were short sales and foreclosures), and that caused prices to tumble. Today, there’s a shortage of inventory, which is causing the acceleration in home values to continue.

4 Simple Graphs Showing Why This Is Not a Housing Bubble | MyKCM

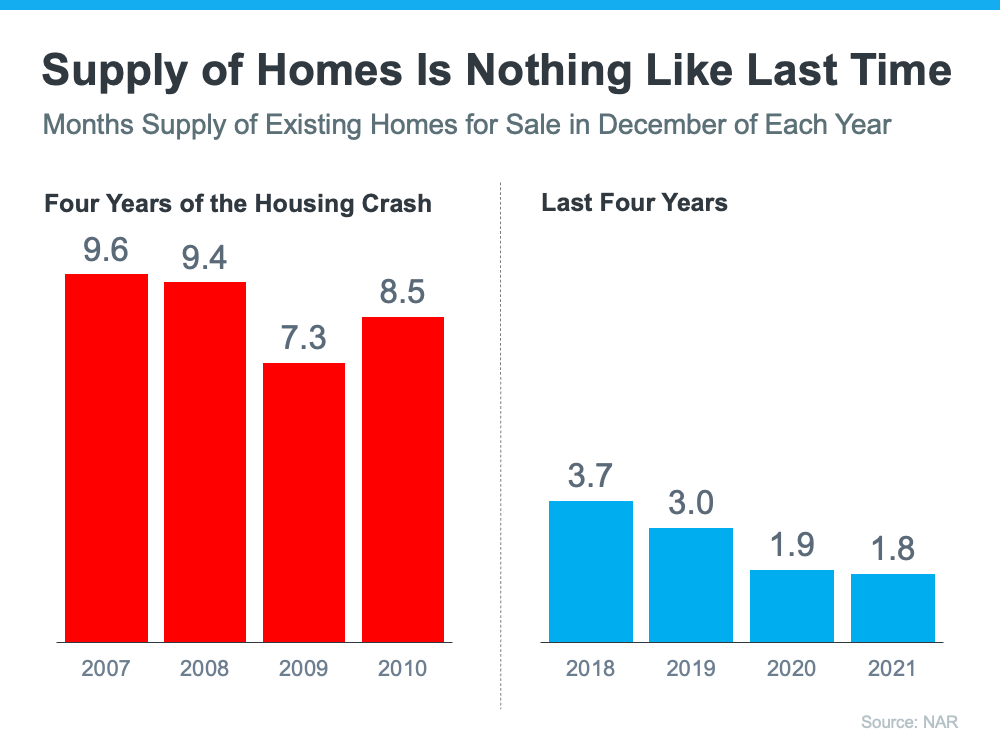
Inventory is nothing like the last time. Prices are rising because there’s a healthy demand for homeownership at the same time there’s a shortage of homes for sale.

Bottom Line

If you’re worried that we’re making the same mistakes that led to the housing crash, the graphs above show data and insights to help alleviate your concerns.

Sell Your Property Before Spring On Mt. Hood

by Liz Warren


Mt. Hood Real Estate Statistics for November 2021

by Liz Warren

Check out the Mt. Hood Real Estate statistics for November 2021 from our multiple listing service. Some crazy highlights include an average sale price of $557,300!! Pending sales down nearly 59% compared to last year at this time.  Only six active listings for the month! Hard to believe but a whopping 18 closed sales for the month. The Average Sales Price is up 30.7% for the year!


Mt. Hood Real estate info for November 2021


Statistics for the Portland Metro area for December are below. Inventory sits at a tab more than a half of a month!!! I don’t know anyone who has ever seen anything like this. Where are the sellers right now?


Mt. Hood and Portland Area RMLS statistics for December 2021


December Newsletter for Mt. Hood Real Estate

by Liz Warren

In case you missed this:

HAPPY NEW YEAR!

These are interesting times for Mt. Hood real estate as we head into 2022. After reviewing Novembers final sales we see a total of 18 closing with six sales under $400,000. Timberline Rim, one of the mountains most affordable subdivisions, saw five sales with three over a half a million dollars! November also produced the first  $500,000 forest service cabin sale! More "off the chart" record breaking numbers were in Collins Lake at Government Camp. Three units have sold since July for $537,000, $557.000 and one at $606,000.

Needless to say, nearly every property that hits the market has five or more offers on the table making this the most amazing sellers market in Mt. Hood history. Two thousand twenty two will be very interesting if we don't get more inventory soon. Currently there are seven properties for sale and three are over a million dollars. 

Recent snows may have slowed buyers down a little bit but the bottom line is once the current eleven pending sales close we will be down to nearly zero properties. Who knows what next year will look like at this point. This year we had a 30% increase in prices which was probably the greatest of all the areas tracked in our multiple listing. No doubt about it, Mt. Hood is the place to be!


Mt. Hood Real Estate Sales for November 2021

Listed below are Novembers closed sales in Brightwood, Welches, Rhododendron and Government Camp. 

Mt. Hood Village Real Estate Sales for November 2021

Mt. Hood Village 2021 November Real Estate Sales

Mt. Hood Village Real estate sales for 2021 November

Mt Hood Village November 2021 Real Estate sales

December National News

U.S. Real Estate Overview

Note: November 2021 data below are the most recent released by the National Association of Realtors.

Existing-home sales rose in November, denoting three consecutive months of increases, according to the National Association of Realtors®. Three of the four major U.S. regions reported growth in monthly sales, while the fourth region held steady in November. From a year-over-year perspective, only one region experienced a rise in sales as the three others saw home sales decline.

Total existing-home sales (transactions that include single-family homes, townhomes, condominiums and co-ops) grew 1.9% from October to a seasonally adjusted annual rate of 6.46 million in November. Sales fell 2.0% from a year ago (6.59 million in November 2020).

“Determined buyers were able to land housing before mortgage rates rise further in the coming months,” said Lawrence Yun, NAR’s chief economist. “Locking in a constant and firm mortgage payment motivated many consumers who grew weary of escalating rents over the last year.
 
“Mortgage rates are projected to jump in 2022, however, I don’t expect the imminent increase to be overly dramatic.”
 
Yun forecasts the 30-year fixed mortgage rate to average at 3.7% by year-end of 2022.

Total housing inventory at the end of November amounted to 1.11 million units, down 9.8% from October and down 13.3% from one year ago (1.28 million). Unsold inventory sits at a 2.1-month supply at the current sales pace, a decline from both the prior month and from one year ago.

The median existing-home price for all housing types in November was $353,900, up 13.9% from November 2020 ($310,800), as prices increased in each region, with the highest pace of appreciation in the South region. This marks 117 straight months of year-over-year increases, the longest-running streak on record.

“Supply-chain disruptions for building new homes and labor shortages have hindered bringing more inventory to the market,” said Yun. “Therefore, housing prices continue to march higher due to the near record-low supply levels.”
 
Yun noted that inflation and the pace of price appreciation is expected to subside next year. Last week, NAR held its third annual Real Estate Forecast Summit, featuring economists and housing experts whose consensus found inflation would likely ease in 2022 at a 4% rate, while home prices are expected to rise at a moderate pace of 5.7%.

Properties typically remained on the market for 18 days in November, equal to October and down from 21 days in November 2020. Eighty-three percent of homes sold in November 2021 were on the market for less than a month.

In October, first-time buyers were responsible for 26% of sales in November, down from 29% in October and from 32% in November 2020. NAR's 2021 Profile of Home Buyers and Sellers – released earlier this month – reported that the annual share of first-time buyers was 34%.

Individual investors or second-home buyers, who account for many cash sales, purchased 15% of homes in November, down from 17% in October and up from 14% in November 2020. All-cash sales accounted for 24% of transactions in November, equal to October’s percentage, and up from 20% from November 2020.
 
According to Freddie Mac, the average commitment rate for a 30-year, conventional, fixed-rate mortgage was 3.07 in November, equal to October’s rate. The average commitment rate across all of 2020 was 3.11%.


Investing in Real Estate

Today's low interest rates and rising home prices have created some great investment opportunities!

Investing in real estate has unique advantages over other types of investments. Let's take a look at some of the reasons why real estate investment should be on the "short list" for many investors:

  • Interest in mortgage loans are tax-deductible. Investors can lower their tax liability while increasing their equity.
  • Renters pay down your mortgage loan. Investors reap the benefits of rental income, which offsets your mortgage cost and build equity.
  • Real Estate values increase over the long term. Real Estate is limited and will always be in demand. 
  • 1031 exchanges are available to defer taxable income when you are ready to sell.

Many investors are taking advantage of these great market conditions. Have questions? Give us a call. We are happy to help!

Are bi-weekly payments right for you?

Many people ask about bi-weekly payment plans designed to reduce the interest paid out over the course of your loan. These programs help the borrower budget an extra payment a year, and over time this can knock years off the repayment schedule.

Many people are surprised to learn that they can do this themselves without any special programs, simply by submitting an extra principal payment as they are able. By submitting an extra payment, you get the advantages of an early payout, without the extra contractual obligation. Want more information on other mortgage options?

Contact us today for our list of preferred local mortgage experts who can help you position yourself for a great year in 2020!


It's Now Much Easier to Buy A Home

Why It Just Became Much Easier To Buy a Home

Why It Just Became Much Easier To Buy a Home | MyKCM
 

Since the pandemic began, Americans have reevaluated the meaning of the word home. That’s led some renters to realize the many benefits of homeownership, including the feelings of security and stability and the financial benefits that come with rising home equity. At the same time, many current homeowners have decided their house no longer meets their needs, so they moved into homes with more space inside and out, including a home office for remote work.

However, not every purchaser has been able to fulfill their desire for a new home. Here are two obstacles some homebuyers are facing:

  • The ability to save for a down payment
  • The ability to qualify for a mortgage at the current lending standards

This past week, both of those challenges have been mitigated to some degree for many purchasers. The FHFA (which handles mortgages by Freddie MacFannie Mae, and the Federal Housing Administration) is raising its loan limit for prospective purchasers in 2022. The term used to describe the maximum loan amount they will entertain is the Conforming Loan Limit.

What Is the Difference Between a Conforming Loan and a Non-Conforming Loan?

Investopedia explains the difference in a recent post:

“Conforming loans are the only loans that meet the requirements to be acquired by Fannie Mae and Freddie Mac. Jumbo loans, which exceed the conforming limit, are the most common type of nonconforming loan.”

What Difference Does It Make to Me as a Home Buyer?

Forbes article earlier this year explains the benefits of a conforming loan and why they exist:

“Since lenders can’t sell non-conforming loans to Fannie Mae or Freddie Mac to free up their cash, they’re a bit riskier for the lender. This is especially true for jumbo loans, which aren’t backed by any government guarantees. If you default on a jumbo loan, it’s a huge blow to the lender.

Thus, lenders generally charge higher interest rates to compensate, and they can have even more requirements. For example, lenders who give out jumbo loans often require that you make a down payment of at least 20% and show that you have at least six months’ worth of cash in reserve, if not more.”

What Happened Last Week?

The FHFA has significantly increased its Conforming Loan Limits for 2022. Sandra L. Thompson, FHFA Acting Director, explains in the press release that:

“Compared to previous years, the 2022 Conforming Loan Limits represent a significant increase due to the historic house price appreciation over the last year. While 95 percent of U.S. countie​s will be subject to the new baseline limit of $647,200, approximately 100 counties will have conforming loan limits approaching $1 million.”

This means that more homes now qualify for a conforming loan with lower down payment requirements and easier lending standards – the two challenges holding many buyers back over the last year.

The Federal Housing Administration (FHA) also increased its Conforming Loan Limits for 2022. That could also mean an easier path to homeownership for many prospective buyers. As the Forbes article explains:

“FHA loans can be very beneficial if you don’t have as much savings, or if your credit score could use some work.”

Bottom Line

Buying your first or your next home may have just gotten much easier (less stringent qualifying standards) and less expensive (possibly lower mortgage rate). Let’s connect to discuss how these changes may impact you.

Resources:
  1. To get more information on the new FHFA Conforming Loan Limits, click here.
  2. To get more information on the new FHA Conforming Loan Limits, click here.

Here’s to a Wonderful 2022!

by Liz Warren


Here's to a Wonderful 2022! | MyKCM

Why You Shouldn't Sell Your Home on Mt. Hood Without an Agent

by Liz Warren


Expert Insights on the Mt. Hood 2022 Housing Market

by Liz Warren


Displaying blog entries 21-30 of 348

Syndication

Categories

Archives

Contact Information

Photo of Liz Warren Real Estate
Liz Warren
Merit Properties Group - Keller Williams Realty PDX Central
Box 131
Welches OR 97067
Direct: 503-705-3090